
CupInfo Home | 2021 America's Cup: Teams | Previous Events | Feature Articles | Books | CupStats
Welcome to
CupStats!
2013 America's Cup Match: Cupstats Home
On this page: America's Cup 2013 - ETNZ vs. Oracle Team USA:
Speed Maps 2013 America's Cup Race 18
Speed Maps: Speed-Over-Ground Leg-by-Leg
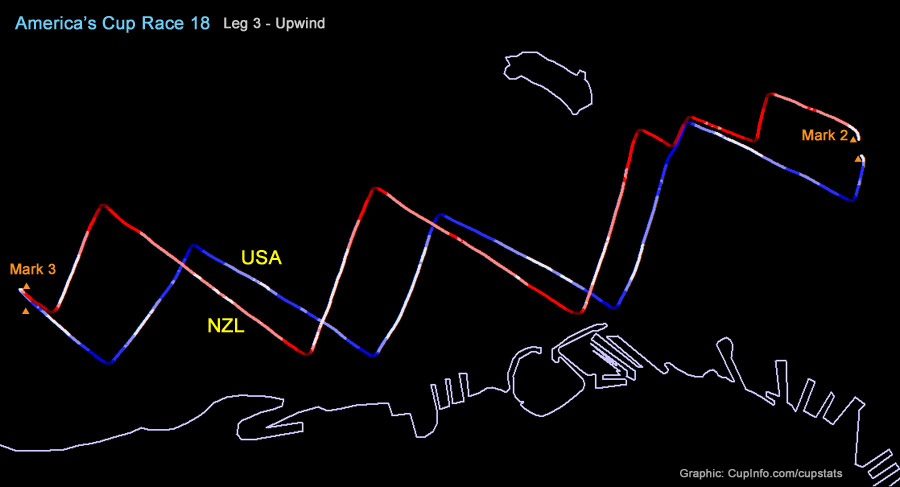
Colors: Blue is USA, Red is NZL. Darker colors are slowest, lighter colors
are fastest.
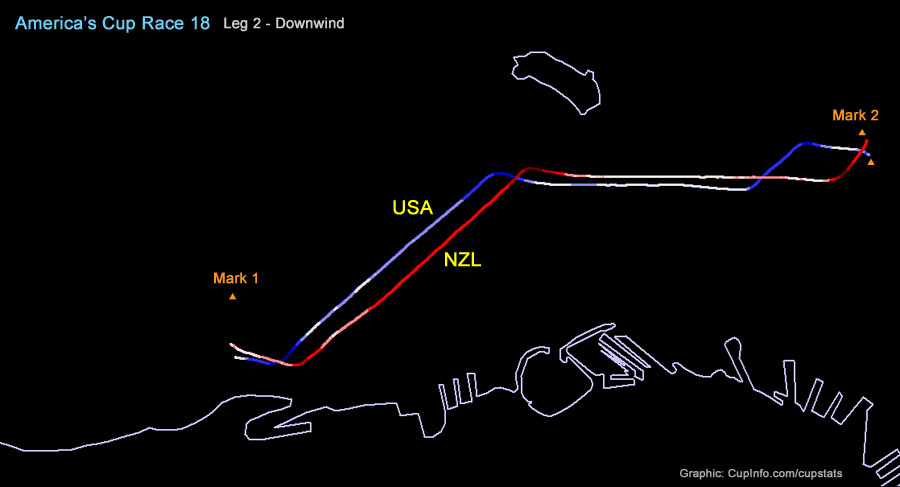
Emirates Team New Zealand gained 2 seconds on this leg.
Emirates Team New Zealand began this leg with the lead by seven seconds.
Note on this leg the number of tacks for ETNZ (10) and Oracle (7). ETNZ's
second tack, at upper right, is where NZL on starboard did not cross USA.
Instead NZL tacked ahead to leeward on port. They sailed parallel courses,
and had to tack at the boundary soon after, but NZL could not live on USA's hip
and had to tack away to the boundary again. Additionally, compare the
difference course angles at the top of the leg. ENTZ trailed Oracle by 56
seconds around Mark 3. Also:
See Video and photo sequence at CupExperience
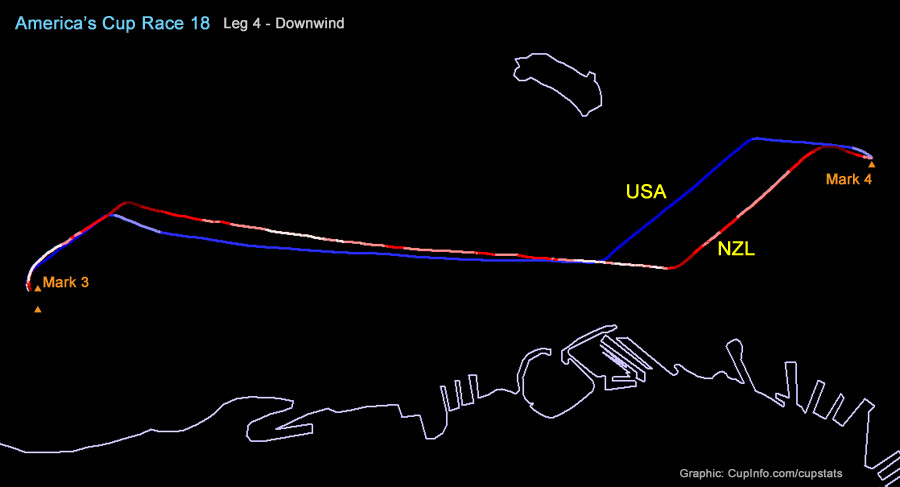
Emirates Team New Zealand gained 8 seconds on this leg. See Gains/Leads Chart
The maps plotted above color the tracks of each yacht according to the relative speed of the yacht at each point on the course as compared to all other data points on the same leg. The points are classified by color based on five quantile groups. Positions of the marks are approximated for illustration purposes.
2013 Louis Vuitton Cup: Louis Vuitton Cup Stats | LVC Results
Previous Event Stats: 2007 America's Cup & Louis Vuitton Cup
Inquiries please contact: